McKinsey & Co. — Corporate Finance Platform
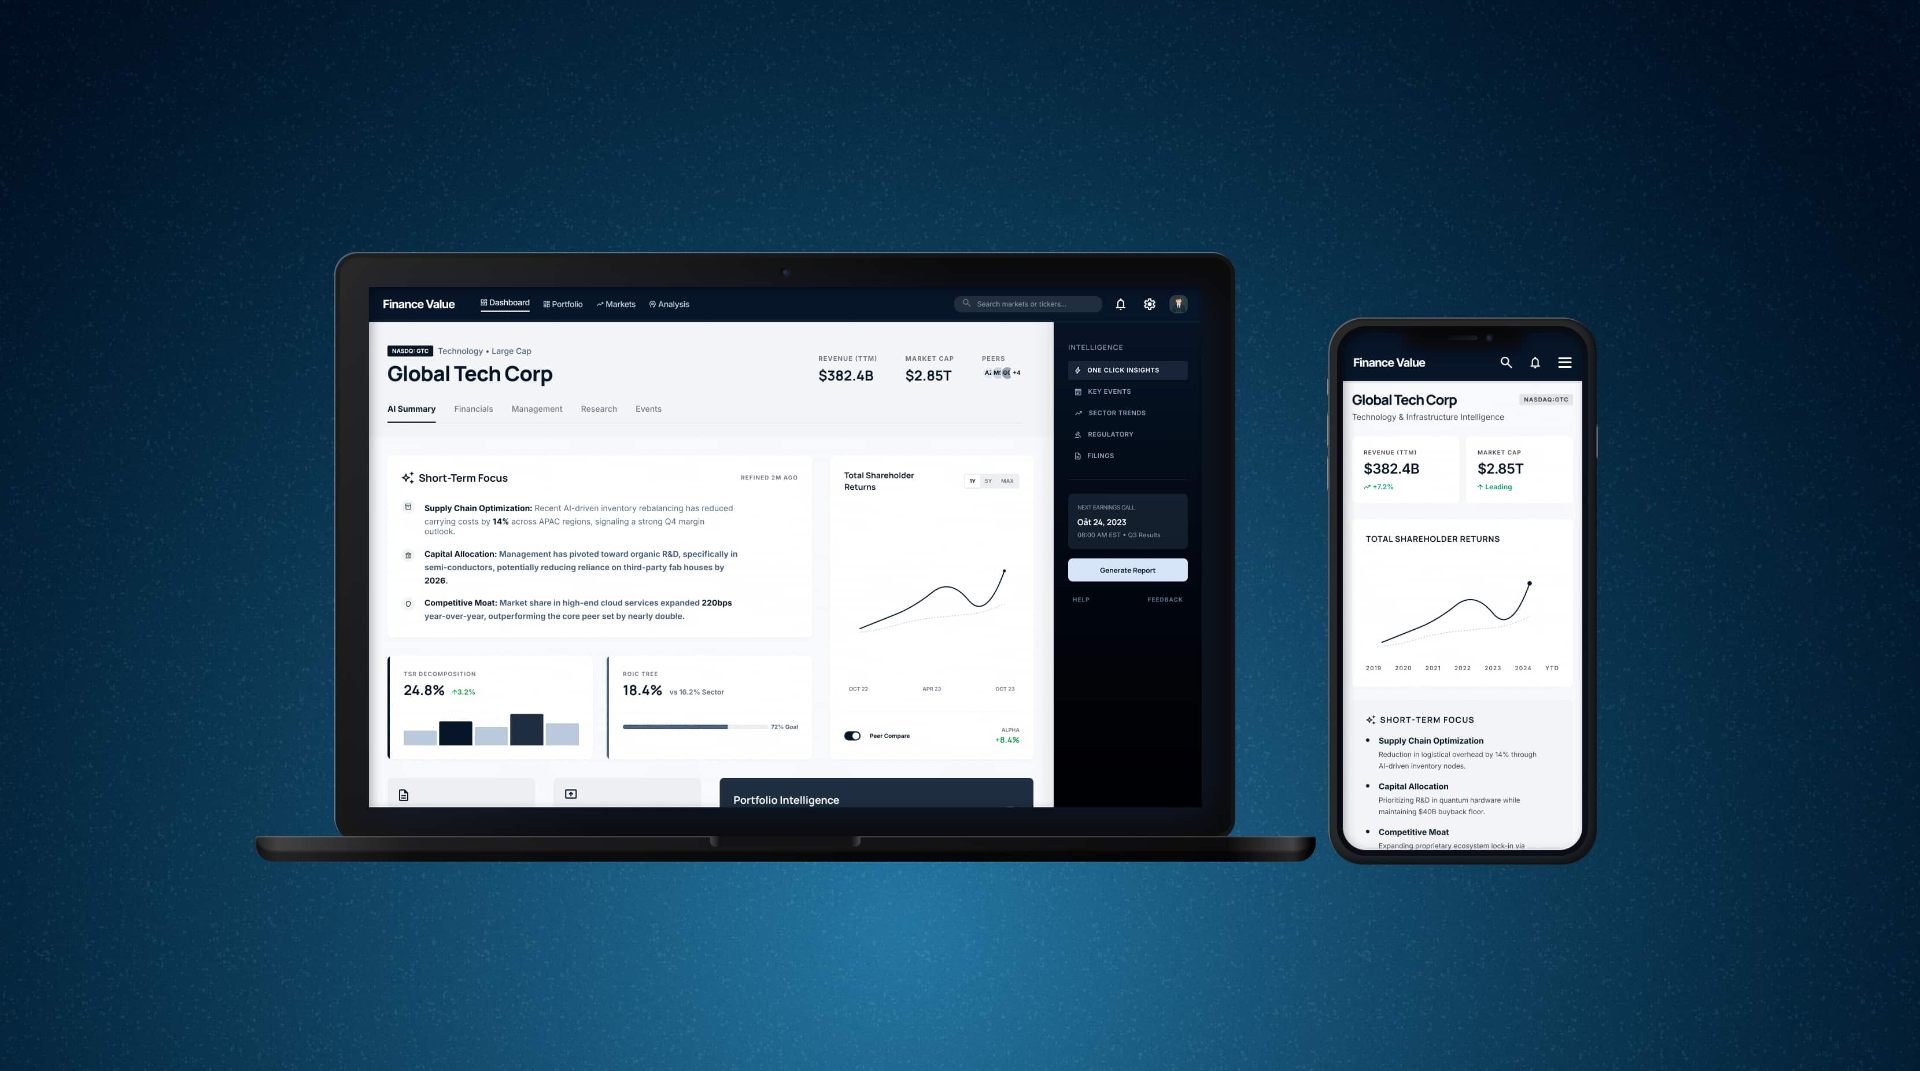
The prototype below is a purpose-built demonstration. All data, company names, and scenarios are fictional — original NDA obligations prevent sharing production screens from the live platform.
View interactive prototype →30% reduction in analyst time-to-insight — by rebuilding the platform around decisions, not data.
Context & Role
Led product and UX design for a suite of internal corporate finance platforms supporting strategy, private equity, and transformation teams. The platform was used to analyse portfolio performance, identify value levers, and simulate strategic scenarios across active client engagements.
Scope: end-to-end product design across research, UX architecture, dashboard systems, AI-assisted insight tools, and design systems — working closely with partners, consultants, data scientists, and engineers.
Scale: adopted across 40,000+ employee teams globally, supporting strategic analytics for hundreds of consulting engagements per year.
The Problem
The platform functioned mainly as an analytical backend, not a true decision-support tool. Despite strong underlying analytics, teams still depended on fragmented spreadsheets, disconnected tools, and static decks — leading to slow time-to-insight, high manual effort, inconsistent outputs, and difficult onboarding.
Consultants spent disproportionate time preparing data, while partners lacked fast access to clear, decision-ready insights.
The opportunity: reshape it into a continuous strategic decision platform that compressed time-to-insight by 30%, standardised value analysis, and enabled teams to move from report production to real-time decision support.
30%
Time saved
Reduction in analyst time-to-insight through leaner information architecture and faster content access.
40,000+
Users globally
Adopted across strategy, private equity and transformation teams worldwide.
4
Integrated layers
Insight, simulation, AI intelligence and design system — delivered end-to-end.
Product Strategy & Success Metrics
Three product pillars defined with partners, engagement teams, and engineering:
- Speed to insight — surface value drivers and risks faster.
- Decision clarity — elevate executive-level signals, not raw data.
- Platform scalability — enable consistent use through reusable UX systems.
Success measured through: time to first meaningful insight, usability task success and comprehension, reduction in manual analysis and reporting effort, adoption across teams and practices, design and development velocity through systemisation.
The Process
Led discovery and validation with partners, consultants, analysts, and data scientists through workshops, workflow mapping, and iterative usability testing. Three patterns consistently emerged: teams thought in hypotheses and value levers, not dashboards; leaders needed narrative clarity, not dense data; complexity had to be progressive, not upfront.
Early tests showed users missing key insights and taking too long to complete core tasks — directly informing a re-architecture of the information hierarchy, navigation model, and interaction patterns.
The Outcome — Four Integrated Layers
The redesign delivered a measurable 30% reduction in time spent by analysts reaching key insights — achieved through four integrated layers:
Insight-first experience layer: rebuilt information architecture around value drivers and executive questions. High-impact KPIs front-loaded, visual hierarchy simplified, progressive disclosure introduced.
Scenario & simulation layer: designed interactive what-if and comparison tools to replace static spreadsheets, enabling teams to test strategic options and model outcomes directly in the platform.
AI-assisted intelligence layer: introduced natural-language interactions and automated insight summaries to accelerate analysis and support faster movement from data to narrative.
Design system & platform foundations: built a modular design system for analytics products, standardising dashboards, tables, and simulation components for consistency and faster delivery.
Tools & Methods
Figma, design systems, AI-assisted prototyping, stakeholder workshops, user interviews, usability testing.
Design System
Visual Language & Components
Colour Tokens
Typography
$2.85T
Global Tech Corp
NASDAQ: GTC · REFINED 2M AGO
Buttons
Badges
Data Card
Revenue
$4.2B
↑ 12.3%
Icons